Performance Comparison of iOS Devices
Below is a list of factors to take into consideration when view the benchmark graphs.
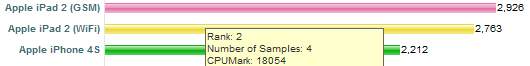
For a device type to be included on the charts it needs to have had at least 1 submitted results. This is to help avoid a single really good or really bad result from throwing a device into a completely incorrect place in the chart. Due to the final score being an average of all benchmarks submitted for that device it is still possible for one or more incorrect results to throw off the whole result when there is a small sample size. For this reason we have included information in the graph about how many devices of that type have been benchmarked. To see this information simply move the mouse over the bar of the device you are interested in. A higher sample size means the data is more likely to be accurate. (Update: for a couple of new rare devices we have included results from a single sample.)
|
|
The PerformanceTest Mobile software is designed to run on several different versions of Apple's iOS operation systems. These different OS have different levels of efficiency and as such a specific device might perform better or worse depending on what OS is installed. Many of these results were submitted by our users. In some cases some of the devices might have had configuration issues leasing to sub-optimal results. When a large number of samples are available this is not an issue but when only a small number of results are available it can sway the results.
The rating the devices are given here represents their peak performance and not necessarily there real world performance with any specific software application. This is especially true in the case of devices with multiple cores. While PerformanceTest Mobile was designed to make use of all cores/CPU’s at once, many real world applications are not designed with this in mind, especially older applications. Unlike single core/CPU systems these systems will only show their full potential in high-performance situations such as when heavily multitasking is required, the average user might not see nearly as much improvement from them.
Due to the fact that these graphs are automatically generated the names of the devices have been taken straight from the devices themselves. However, some devices do not provide correct names. The actual device may identify themselves as something different. From time to time, we will try to clean up the names and make them more readable. In some cases we have picked up names of rare or low volume devices. Just because you haven't heard of a particular device, doesn't mean it doesn't exist.
The results have been collected over using PerformanceTest Mobile V0.4.3 and up.
Some people have contacted us to tell that we have messed up and duplicated various devices in the graph . To the best of our knowledge this is not the case. What we have done is separate out devices by their model.
In other cases, there may appear to be a duplication, such as with the iPad 2 (GSM) and iPad 2 (WiFi). In this case Apple has released different versions of this same device.
 iOS PassMark
  Cross-Platform CPU Performance